

In a world overflowing with data, relying on gut feelings to run a business is like navigating a maze blindfolded. The smart move is shifting to data-driven business decisions, where real insights—not just instincts—guide your path to growth. This guide, informed by insights from experts like entrepreneur Robbie LaMattina, breaks down how to build a system that turns raw numbers into a genuine competitive edge. It’s about treating data as a core strategic asset, rather than just an operational chore, to completely change a company's trajectory.
4 Key Takeaways
- A data-centric culture directly boosts customer acquisition and retention, giving you a tangible advantage.
- You absolutely need a clear roadmap to get from basic data gathering to automated, actionable insights.
- Tackling data silos and quality problems is the unglamorous but essential groundwork for making reliable decisions.
- This isn't just for tech companies; the power of a data-first approach shows up in every sector.
Let's break down how you can make this happen in your own business.
Why Gut Feel Is No Longer Enough
Making the switch from instinct-led choices to data-driven business decisions isn't just a good idea anymore; it's critical for staying in the game. The companies that are winning today are the ones who can skillfully collect, analyze, and act on the information they have. This process turns abstract figures into a concrete plan for success.
The fundamental concept is simple: use hard evidence to answer your most important business questions. Instead of guessing what your customers want, you study their actual behavior. Rather than just hoping a marketing campaign is effective, you track specific metrics to measure its real-world impact. This approach dials down the risk and ramps up your chances of success.
The True Impact of Data on Business Strategy
When you adopt a data-first mindset, you create a positive ripple effect that touches every part of your organization. When you're facing down complex challenges and market uncertainty, you can utilize Data-Driven Decisions (DDD) to the rescue to find clarity. It also fosters a culture of accountability where results are measured and strategies can be adjusted on the fly.
"Your job will not be taken by AI. It will be taken by a person who knows how to use AI. So, it is very important for marketers to know how to use AI.” – Christina Inge, Harvard Division of Continuing Education
That same logic applies perfectly to data analytics. Your business won't be replaced by a data-driven competitor overnight. But it will eventually be left behind by leaders who have mastered their data. Making this strategic change brings some powerful benefits:
- Increased Accuracy: Decisions rooted in facts are simply more dependable, leading to much better forecasting and smarter use of resources.
- Deeper Customer Understanding: Data uncovers hidden patterns in customer behavior, allowing you to create personalized experiences that build real loyalty.
- Enhanced Operational Efficiency: By spotting bottlenecks and performance gaps in the data, you can clean up your processes and cut out waste.
Ultimately, weaving data into the fabric of your operations is all about making smarter, faster, and more confident choices. To dig deeper into this idea, take a look at our guide on how strategic decision-making is the key to sustainable business growth.
Crafting Your Data Strategy Blueprint
A strong data practice doesn't just happen; it starts with a clear plan. Too often, businesses fall into the trap of collecting mountains of information without a purpose. To actually make effective data-driven business decisions, you need a blueprint that ties your data directly to your most critical business goals.
The secret? Stop thinking about data and start thinking about questions.
What are the most urgent, unanswered questions your business is grappling with right now? Answering this is the cornerstone of your entire data strategy. For example, instead of a fuzzy goal like "improve marketing," ask a sharp question like, "Which marketing channel delivers customers with the highest lifetime value?"
This simple shift changes everything. It turns data collection from a passive, "just-in-case" chore into a focused, purposeful mission.
From Business Questions to Measurable Metrics
Once you have your core business questions locked in, the next step is figuring out how you'll measure the answers. This is where Key Performance Indicators (KPIs) come into play. Good KPIs are specific, measurable, and directly linked to your business questions—they're the yardsticks you'll use to see if your decisions are actually working.
Let's say your question is about improving customer retention. Your KPIs might include:
- Customer Churn Rate: The percentage of customers who walk away over a given period.
- Repeat Purchase Rate: The proportion of customers who come back for a second buy.
- Customer Lifetime Value (CLV): The total revenue you can reasonably expect from a single customer over time.
Defining these metrics upfront gets everyone on the same page about what success looks like. It also keeps you from getting distracted by vanity metrics and creates a real framework for accountability.
This journey from relying on intuition to using structured data to fuel real growth is what it's all about.
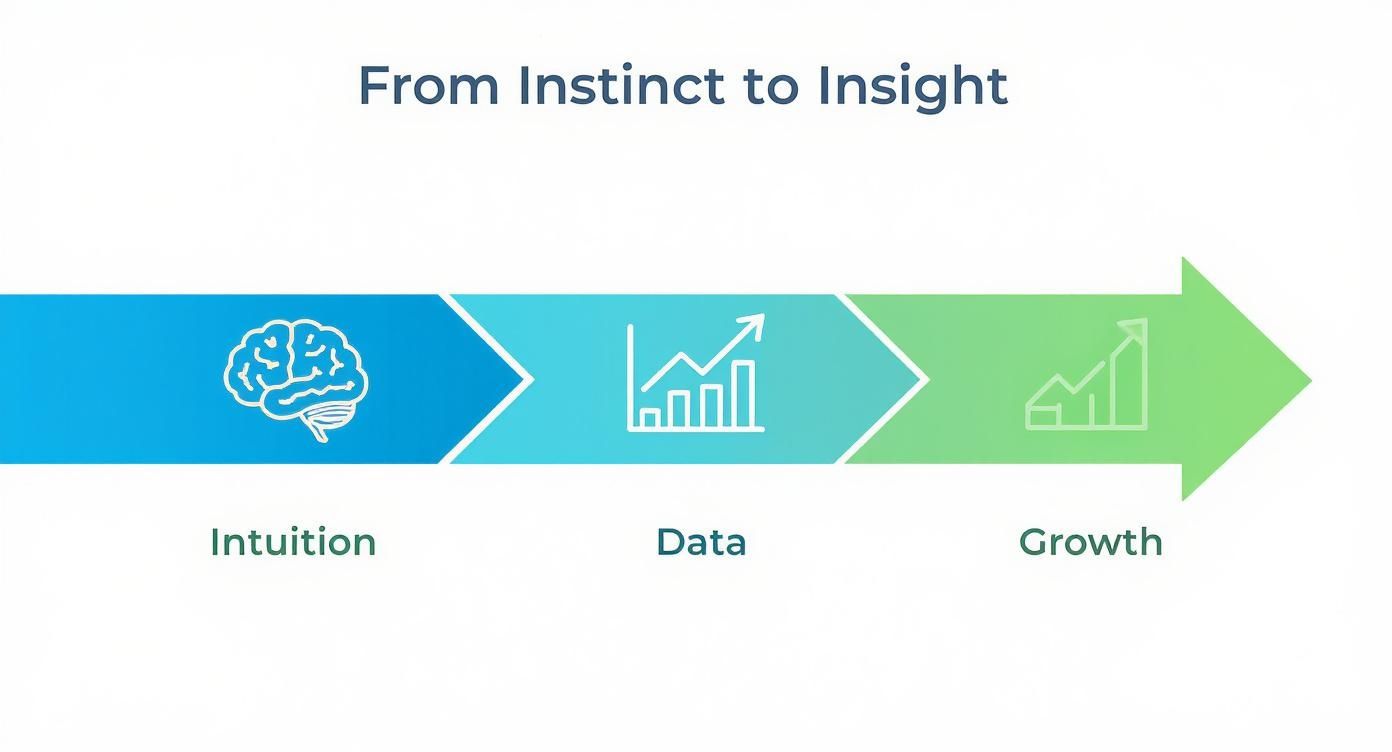
As you can see, data is the bridge that connects your initial hunches to measurable, positive outcomes.
Building a Framework for Governance and Ethics
With a clear plan and the right metrics, you also need guardrails. Data governance isn't just a boring compliance task; it's about setting clear rules for how data is collected, stored, accessed, and used ethically. A solid governance plan builds trust, ensures you're compliant with regulations like GDPR, and, most importantly, maintains the quality of your data.
The sheer volume of information being created makes this non-negotiable. It's estimated that by 2025, the world will be creating 180 zettabytes of data, a huge jump from 149 zettabytes in 2024. And as this data explosion continues, organizations using AI-driven analytics could boost their operational efficiency by up to 25% by finding insights faster. If you want to dig deeper into this trend, you can explore mastering data-driven decision making on sparkco.ai.
A data strategy without governance is like a library with no cataloging system. You might have all the information in the world, but finding what you need is nearly impossible, and you can't trust what you find.
A Real-World Blueprint in Action
Let’s look at a practical example. Imagine a mid-sized e-commerce company struggling with a high customer churn rate. Instead of throwing random discounts at the problem, they decide to build a data strategy.
Here’s what their process looks like:
- Define the Business Question: "Why are customers leaving after their first purchase, and what can we do to keep them?"
- Identify Key Data Sources: They zero in on data from their CRM (purchase history, communication logs), website analytics (user behavior on product pages), and support tickets (common complaints).
- Set Measurable KPIs: They choose to track the churn rate for first-time buyers, the time between the first and second purchase, and customer satisfaction scores after support interactions.
- Establish Governance: They create clear guidelines on who can access customer data and for what purpose, ensuring privacy and consistency.
By following this blueprint, the company shifts from a state of reactive panic to proactive problem-solving. They’re no longer just collecting data; they are using it to make targeted, informed decisions designed to solve a specific, high-value problem. That’s an effective data strategy in a nutshell.
2. Building Your Data Collection and Analytics Engine
Once you've mapped out your strategy, it's time to get your hands dirty and build the technical engine that will actually power your decisions. This isn't just a job for the IT department—every leader needs a solid grasp of how raw information gets turned into a real strategic asset. Think of it as building the digital highways for your company. Get the foundation right, and the insights will flow.
The whole process kicks off with choosing the right tools to gather information. This isn't about buying the most expensive software on the market; it's about picking platforms that directly address the business questions you defined earlier.

Selecting Your Data Collection Toolkit
The tools you select will be completely unique to what you need to measure. A brick-and-mortar retail business has very different data needs than a SaaS company. The real goal is to create a seamless flow of information from every single place a customer interacts with your brand.
Some of the most common tools I see in a modern data stack include:
- Customer Relationship Management (CRM) Systems: Platforms like Salesforce or HubSpot are absolute goldmines. They hold your sales data, customer interaction logs, and service history, telling you who your customers are.
- Web Analytics Platforms: Google Analytics is the classic for a reason. It tracks everything from website traffic and user behavior to conversion funnels, revealing how people find and interact with you online.
- Social Media and Marketing Tools: These give you a direct line into campaign performance, audience sentiment, and brand perception across various channels.
- IoT Sensors and Devices: For businesses in logistics, manufacturing, or even commercial real estate, data from physical sensors can provide an invaluable, real-time view of operations and asset performance.
The magic happens when you integrate these sources. Data that’s stuck in isolated silos is basically useless. A truly effective system lets you connect a customer’s website visit to their purchase history in your CRM and their feedback on social media. That's where the story comes together.
The Non-Negotiable: Data Quality and Integrity
Collecting data is easy. Collecting good data is hard. Low-quality information—full of errors, duplicates, and missing values—will absolutely lead to flawed conclusions and costly mistakes.
Garbage in, garbage out. It’s an old saying, but it’s the golden rule of data analytics. Investing time in data cleaning and validation upfront will save you from making terrible decisions based on bad information down the road.
To keep your data quality high, you’ll want to focus on a process often called ETL (Extract, Transform, Load). It sounds technical, but the idea is simple: you pull data from its source, clean it up into a consistent format, and then load it into a central place (like a data warehouse) where it’s ready for analysis.
For a deeper dive, check out our guide on leveraging data analytics for business growth.
Choosing the Right Analytics Platform
Once your data is clean and in one place, you need tools to make sense of it all. The right analytics platform turns dense spreadsheets into intuitive charts, graphs, and dashboards that tell a compelling story. The choice of tool really comes down to your team's skill level and the complexity of your questions.
Here’s a quick breakdown of your options:
| Tool Category | Best For | Examples |
|---|---|---|
| Spreadsheets | Basic analysis, small datasets, and quick-and-dirty calculations. | Microsoft Excel, Google Sheets |
| Business Intelligence (BI) Tools | Creating interactive dashboards and exploring large datasets visually. | Tableau, Power BI, Looker |
| Advanced Analytics Platforms | Predictive modeling, machine learning, and deep statistical analysis. | Python/R with libraries, SAS |
Don't fall into the trap of thinking you need the most powerful, complex option from day one. Many businesses can uncover game-changing insights with a well-organized spreadsheet or a user-friendly BI tool. Start simple. Find the easiest tool that can answer your most critical questions, and then scale up as your team's skills and needs evolve.
The goal is to empower your team to explore data on their own, making data-driven decision-making a daily habit, not a special project.
From Raw Data to Actionable Business Insights
Having the right data infrastructure is a huge step, but raw data is just potential energy. The real value gets unlocked when you turn that potential into kinetic energy—clear, actionable insights that fuel smarter data-driven business decisions. This is where the art and science of analytics come together, turning numbers on a screen into a strategic roadmap.
The journey from data to insight follows a logical progression, often broken down into four distinct types of analytics. Each one answers a progressively more complex and valuable business question, building upon the last. Getting a handle on this framework is the key to moving beyond simple reporting and into genuine strategic analysis.
The Four Types of Data Analytics
To really make sense of your data, it helps to think in layers. You can't effectively predict the future if you don't first understand what happened in the past and why it happened. These four types of analytics build on one another to give you a complete picture.
Here's a quick breakdown of how these methods work, what they answer, and how they look in the real world.
| Four Types of Data Analytics for Business Decisions | ||
|---|---|---|
| Analytics Type | Business Question | Example Application |
| Descriptive Analytics | What happened? | A marketing team reviews a dashboard showing that website traffic dropped by 15% last month. |
| Diagnostic Analytics | Why did it happen? | They dig deeper and discover the drop coincided with a major Google algorithm update that impacted their top-performing blog posts. |
| Predictive Analytics | What will happen? | Using historical sales data and customer behavior, the team builds a model for predicting customer churn, flagging accounts likely to cancel in the next quarter. |
| Prescriptive Analytics | What should we do? | The system automatically suggests offering a personalized 10% discount to high-value customers identified by the predictive model to proactively reduce churn. |
Each layer provides a deeper level of understanding, moving you from simply reacting to past events to proactively shaping future outcomes.
From Theory to Practice: A Behavioral Health Case Study
Let's ground this in a real-world scenario. A behavioral health provider, like the ones entrepreneur Robbie LaMattina works with, wanted to improve patient outcomes. They began collecting anonymized data on treatment protocols, patient engagement levels, and recovery milestones.
At first, their descriptive analytics simply showed the average length of stay and completion rates—useful, but not game-changing. It was when they applied diagnostic analytics that they had a breakthrough: they found a strong correlation between patients who participated in specific group therapy sessions and higher long-term success rates.
This single insight led to a predictive model that could identify new patients at high risk of disengaging. From there, they used prescriptive analytics to recommend personalized intervention plans for these individuals, suggesting specific therapies and support structures to boost their chances of success. The result was a tangible improvement in patient care, all driven by a structured approach to data analysis.
The Power of Visualization and Storytelling
Insights are completely useless if they stay locked in a spreadsheet. To truly empower your organization, you have to communicate your findings in a way that everyone—from the C-suite to the front lines—can understand and act on. This is where data visualization and storytelling become critical.
A well-designed dashboard can convey complex trends in seconds. Instead of a dense report, stakeholders can see a clear visual representation of performance, making it far easier to spot opportunities and risks.
The goal is not to create beautiful charts; the goal is to create understanding. Effective data storytelling builds a bridge between complex analysis and the people who need to make decisions based on it.
This isn't just a nice-to-have. Firms that effectively use data-driven strategies are 23 times more likely to acquire new customers and 6 times more likely to retain them. This success hinges on making data accessible.
To do this, focus on building intuitive reports that highlight the "so what?" behind the numbers. Don't just show a chart; explain what it means for the business and recommend a clear next step. When you pair this with direct feedback, your insights become even more powerful.
Fostering a Culture of Data-Driven Decision Making
You can have the most sophisticated analytics tools and the cleanest data pipeline on the planet, but they’re practically useless if your team isn’t ready to embrace them. I’ve seen it time and again: the most common roadblock to making smart, data-driven business decisions isn’t a technical one. It's a human one. It’s about culture.
Creating an environment where data is the default language for every conversation and decision is the final, and most critical, piece of the puzzle.
This all starts at the top. When your leadership team consistently stops and asks, "What does the data say?" before making a move, it sends a clear signal across the entire organization. Getting that executive buy-in isn't just nice to have; it’s the air cover your teams need to experiment, learn, and even fail, all while using data as their north star.
Breaking Down Silos and Building Literacy
One of the biggest cultural hurdles I’ve encountered is the data silo. You know the drill: marketing jealously guards its customer analytics, sales has its CRM data on lockdown, and operations has its own performance metrics. The problem is, none of them are talking to each other. Real, game-changing insights only happen when you connect the dots between these disparate sources to get a single, holistic view of the business.
The only way to tear down those walls is by actively encouraging cross-functional collaboration. Here are a few ways to get started:
- Shared Dashboards: Build centralized dashboards that track KPIs relevant to multiple departments. This creates a shared sense of ownership and gets everyone looking at the same numbers.
- Cross-Functional Projects: Kick off initiatives that require input and data from different teams. This forces people out of their comfort zones and helps them appreciate each other's challenges.
- Regular Data Reviews: Schedule recurring meetings where teams present their findings to the wider group. This sparks new conversations and creates a space for shared learning.
Beyond just working together, you need to invest in data literacy training. Not everyone needs to become a data scientist, but every single person on your team should be comfortable reading a chart, understanding core metrics, and asking tough questions about the data they're presented with. This empowers people at all levels to join the conversation.
Leading the Charge and Celebrating Wins
Changing a company's culture is a marathon, not a sprint. It takes persistent leadership and a clear, unwavering vision. As entrepreneur Robbie LaMattina, who has steered organizations through these kinds of shifts, points out, the key is to show tangible value early and often. Start with small, high-impact wins.
The goal is to create a positive feedback loop. When a team uses data to make a small but successful decision—like tweaking a marketing campaign to increase conversions by 5%—you must celebrate that win publicly. It proves the concept and makes others eager to follow suit.
These small victories build on each other, slowly shifting the company mindset from "this is how we've always done it" to "let's see what the data suggests." By creating consistent feedback loops where insights are openly discussed and baked into daily workflows, you make data a part of your company's DNA.
This is how you build an organization that doesn't just collect data, but truly lives by it, making smarter data-driven business decisions a natural reflex.
Avoiding the Traps and Building a Strategy That Lasts
Shifting your organization to be more data-driven is one of the smartest moves you can make. But let's be honest, it’s rarely a straight line from A to B. I've seen countless leaders hit roadblocks that can grind progress to a halt if they aren't prepared. The key is knowing what these common pitfalls look like ahead of time so you can build a resilient strategy that stands the test of time.
Two of the biggest culprits are deeply human. First, there's confirmation bias—that all-too-common tendency to hunt for data that proves what we already believe and conveniently ignore anything that challenges it. Then you have its close cousin, analysis paralysis, which happens when the sheer volume of data is so overwhelming that nobody can make a decision at all.
Sidestepping the Common Hurdles
Getting past these obstacles isn't about finding a magic bullet; it's about building the right habits and systems. To counter confirmation bias, you have to actively cultivate a culture of curiosity. Start rewarding people for asking tough questions and challenging assumptions, not just for finding data that makes everyone feel good. Simple things like peer reviews for data analysis can work wonders here, bringing a fresh set of eyes to the table.
And when it comes to analysis paralysis? The answer is focus. Always bring it back to the core business questions you defined at the very start. This forces your team to zero in on the metrics that truly matter and stops them from getting lost down a rabbit hole of irrelevant information. Your goal is to find the signal in the noise, not to analyze the noise itself.
"Your job will not be taken by AI. It will be taken by a person who knows how to use AI." This quote from Christina Inge of Harvard really hits home here. Your data strategy won’t fail because of the tech; it will falter if your people aren't trained to think critically and use the tools effectively.
Gearing Up for What's Next in Analytics
Looking down the road, it's clear that AI and machine learning are becoming central to data analytics. These aren't just buzzwords anymore; they're essential for automating the kind of complex analysis that no human team could ever manage on their own, uncovering insights at an incredible scale. A truly adaptable data framework has to be built with these tools in mind.
A massive challenge for most organizations is figuring out what to do with unstructured data—all those customer reviews, support emails, and social media comments. In fact, a staggering 95% of businesses say they struggle to manage and use this kind of information. As entrepreneur Robbie LaMattina points out, this is precisely where new AI tools can unlock incredible value, turning all that qualitative feedback into hard, quantitative insights. If you want to dive deeper into this and other trends, you can discover key 2025 business insights on quantive.com.
So, how do you future-proof your strategy? I always recommend focusing on a few key areas:
- Invest in Tech That Can Grow: Don't get locked into a rigid platform. Choose analytics tools that are built to scale and can easily plug into the AI and machine learning ecosystem.
- Make Data Privacy a Priority: As your data collection grows, strong security and ethical governance are absolutely non-negotiable. You have to protect it to maintain customer trust.
- Champion Continuous Learning: The data world moves fast. Create opportunities for your team to stay on top of the latest tools and techniques. This is how you stay ahead of the curve.
By tackling the problems of today while keeping an eye on the innovations of tomorrow, you can make sure your investment in data-driven decisions pays off for years to come.
Frequently Asked Questions
We're a Small Business. Where on Earth Do We Start?
The key is to start small and get a win on the board quickly. Don't try to boil the ocean. The biggest mistake I see is teams trying to build a massive, perfect data system from day one.
Instead, pick one, single business question that really matters. Something like, "Who are our actually most profitable customers?" or "Which marketing channel is giving us the best bang for our buck?" From there, use the tools you already have. Your Google Analytics account or the basic reporting in your CRM has a goldmine of information waiting for you.
The goal here isn’t perfection; it’s momentum. A small, successful project proves the concept, shows everyone the value, and makes it much easier to get buy-in for the next step.
How Can We Maintain Data Quality Without a Big Team?
Good data quality is less about manpower and more about smart, consistent processes. You don't need a dedicated data science team to keep things clean, especially early on.
Focus on a couple of key areas:
- Automate where you can. Use simple validation rules in your forms to catch errors before they even get into your system.
- Schedule regular cleanups. Run automated tasks to find and merge duplicate records.
- Establish a single source of truth. Decide which system holds the master record for your most important metrics and stick to it. As entrepreneur Robbie LaMattina often points out, consistency is far more important than complexity when you're just starting out.
What's the Single Biggest Mistake Companies Make?
Hands down, the most common pitfall is treating this as a tech project instead of a cultural shift. I've seen countless companies spend a fortune on fancy business intelligence tools and data warehouses, only to see them collect digital dust.
Why? They skipped the human part. They didn't get real buy-in from leadership, they failed to train their people on how to use the tools, and they never changed the day-to-day workflows to actually incorporate data.
Success isn't about just having the data. It's about building a culture where people feel empowered to ask questions and are confident using data to find the answers.
At Robert LaMattina, we focus on pragmatic insights that help modern professionals build stronger businesses and improve lives. You can find more actionable strategies for growth and leadership at https://robertlamattina.net.