

Financial forecasting is a strategic map for your startup's future. It’s not about having a crystal ball—nobody expects you to predict the future with 100% accuracy. Instead, it's about creating a living document that guides your decisions, helps you manage cash flow, and ultimately, proves to investors that you have a viable plan. Insights from seasoned entrepreneurs like Robbie LaMattina underscore that a solid forecast is less about being right and more about being thoughtful, forcing you to understand the core drivers of your business. This guide will walk you through building a practical financial model that can secure funding, maximize your runway, and lay the groundwork for a resilient company.
Your 4 Key Takeaways on Financial Forecasting
If you're a founder neck-deep in building the next big thing, you know time is everything. So before we get into the nuts and bolts of startup financial forecasting, let's zoom out and cover the four core principles that should underpin your entire model.
Getting these concepts right from the start, an approach championed by Robbie LaMattina, will make your forecast a powerful tool for growth, not just another spreadsheet gathering dust.
Your Forecast is a Steering Wheel, Not a Crystal Ball
First, get the idea of a perfect prediction out of your head. The goal isn't to guess the future with 100% accuracy. Instead, think of your financial model as a strategic steering wheel—it's there to help you make smarter, data-informed decisions as you navigate the road ahead. This mindset keeps your model grounded and practical.
Your cash flow statement is your ultimate survival guide. For an early-stage company, it's often far more critical than your Profit & Loss statement because it directly measures your runway.
It's All About Unit Economics
A credible forecast is built from the ground up, not the top down. Forget vague, aspirational market-size figures for a moment. Instead, focus on your real-world unit economics, like Customer Acquisition Cost (CAC) and Lifetime Value (LTV).
These are the fundamental building blocks of a sustainable business. If you need a refresher, you can explore a detailed breakdown of key performance indicators for startups to see which metrics truly matter.
A Forecast is a Living Document
Finally, remember that your forecast is not a one-and-done exercise. It's a living, breathing document. You should be updating it constantly with your actual performance data. This continuous feedback loop is what allows you to stay agile, spot problems early, and pounce on new opportunities as the market shifts.
Why Forecasting Is Your Most Critical Survival Tool
Let's cut right to it: the number one reason startups fail is because they run out of cash. It’s the silent killer that sneaks up on even the most promising companies. In fact, poor financial management is a top reason why a staggering 9 out of 10 startups never make it. This is exactly why financial forecasting isn't just some MBA-level exercise; it's your most essential tool for survival.
This guide is all about building a forecast that actually works in the real world. We'll pull from the hard-won experience of entrepreneurs like Robbie LaMattina, who successfully scaled So Cal Health Care Solutions, to give you a pragmatic, no-fluff framework. The goal isn't to create a complex spreadsheet that gathers dust. It's to build a model that helps you secure funding, stretch every dollar of your runway, and build a resilient business from the ground up.

Remember, a solid financial model isn't just an investor pitch tool—it's your internal steering wheel.
A great forecast is less about being right and more about being thoughtful. It forces you to understand the core drivers of your business and how they connect to your bank account.
Getting this process right helps you do three critical things:
- Make decisions based on data, not just gut feelings.
- Allocate your precious, limited resources where they'll have the most impact.
- Spot financial risks on the horizon before they turn into full-blown crises.
Laying the Groundwork with Defensible Assumptions
Every powerful financial forecast is built on one thing: solid, defensible assumptions. Your model is just a house of cards if you’re just throwing hopeful guesses and vague market data at it. This is where the real work begins—laying a foundation of logic that investors can trust and, more importantly, that you can use to make actual decisions. Get this part wrong, and you're already behind.
There's a reason they say cash flow is king. Poor cash management is the number one killer of new ventures, contributing to that staggering 90% startup failure rate you always hear about. A good forecast is your first line of defense. It helps you see trouble coming. With 20.4% of startups failing in year one and that number jumping to 49.4% by year five, this foundational work is absolutely non-negotiable. To get a better handle on these startup failure rates, you can discover more insights about financial forecasting on eqvista.com.
Top-Down vs. Bottom-Up Forecasting
When you start hammering out your assumptions, you’ll run into two main schools of thought: top-down and bottom-up. You need to know the difference, because I can tell you from experience, investors have a strong preference for one over the other.
-
Top-Down Forecasting: This is the big-picture approach. You start with the Total Addressable Market (TAM) and carve out your slice. It sounds like this: "The global market for our product is $10 billion. If we just capture 1%, we’ll be a $100 million company." It’s fine for framing the opportunity, but on its own, it feels abstract and frankly, a bit lazy to an investor.
-
Bottom-Up Forecasting: This is where the rubber meets the road. You build your projections from the ground up, starting with the nuts and bolts of your business—your unit economics. It’s based on real-world drivers like your website traffic, conversion rates, and pricing. This is the method that builds credibility because it shows you actually understand how your business machine works.
Investors don't fund market share dreams. They fund businesses with a clear, logical path to acquiring and serving customers profitably. A bottom-up forecast is your map.
Honestly, the best models often use a blended approach. Use the top-down numbers to paint the big picture and show the size of the prize, but ground your actual forecast in the cold, hard logic of a bottom-up build. It shows you're both ambitious and operationally smart.
Identifying Your Core Business Drivers
At the heart of any good bottom-up forecast are the handful of key drivers that truly move the needle for your business. These are the inputs you can actually measure and influence. Everything else in your model should flow directly from these core assumptions.
For a typical SaaS startup, these drivers might look familiar:
- Monthly Website Visitors: How many people are walking into your digital storefront?
- Visitor-to-Trial Conversion Rate: Of those visitors, what percentage signs up for a free trial? A benchmark between 3-5% is a reasonable starting point for an early-stage company.
- Trial-to-Paid Conversion Rate: How many of those trial users pull out their credit card and become paying customers?
- Customer Acquisition Cost (CAC): What does it cost, on average, to get one new paying customer in the door?
- Monthly Churn Rate: What percentage of your customers cancel their subscription each month?
Think of each of these drivers as a lever. Your forecast is basically you saying, "If we pull this lever to get X website traffic and that lever to get Y conversion rate, it will result in Z revenue." That’s a defensible argument.
A Real-World Scenario with Robbie LaMattina
Let's make this tangible. I've seen this play out countless times, including in the experience of Robbie LaMattina in the healthcare space. While scaling So Cal Health Care Solutions, a key driver wasn't something generic like website traffic; it was the highly specific patient acquisition cost. The assumption wasn't a vague "we'll capture market share," but a defensible calculation built from the ground up.
Here’s what that bottom-up logic looks like in practice:
- Identify Acquisition Channels: First, figure out exactly how you get patients. Is it through digital marketing, referrals from physicians, or community outreach events?
- Calculate Channel-Specific Costs: Now, what’s the cost per lead for each of those channels? For digital ads, it's your ad spend divided by the number of leads. For referrals, it might be the salary of your referral network manager.
- Determine Conversion Rate: What percentage of leads from each specific channel actually converts into a patient? This isn't a guess; it requires real data and testing.
- Build the Assumption: So, if a digital marketing campaign costs $5,000 and brings in 10 qualified leads, and 2 of those leads become patients, your CAC for that channel is $2,500.
This single, well-researched assumption becomes a cornerstone of the entire financial model. It's not a shot in the dark; it's a logical conclusion based on measurable activities. This is the level of detail that elevates your financial model from an academic exercise into a strategic tool you can actually use to grow your company.
How to Build Your Three Core Financial Statements
With your core assumptions nailed down, it’s time to build the engine of your financial model: the three core financial statements. These aren't just isolated spreadsheets. Think of them as three different camera angles on your business, interconnected to tell your complete financial story.
Each statement provides a unique, critical perspective. Getting them to work together is what transforms your assumptions into a real, operational roadmap. The process, often championed by experts like Robbie LaMattina, is about turning abstract ideas into something tangible you can use to steer the ship.
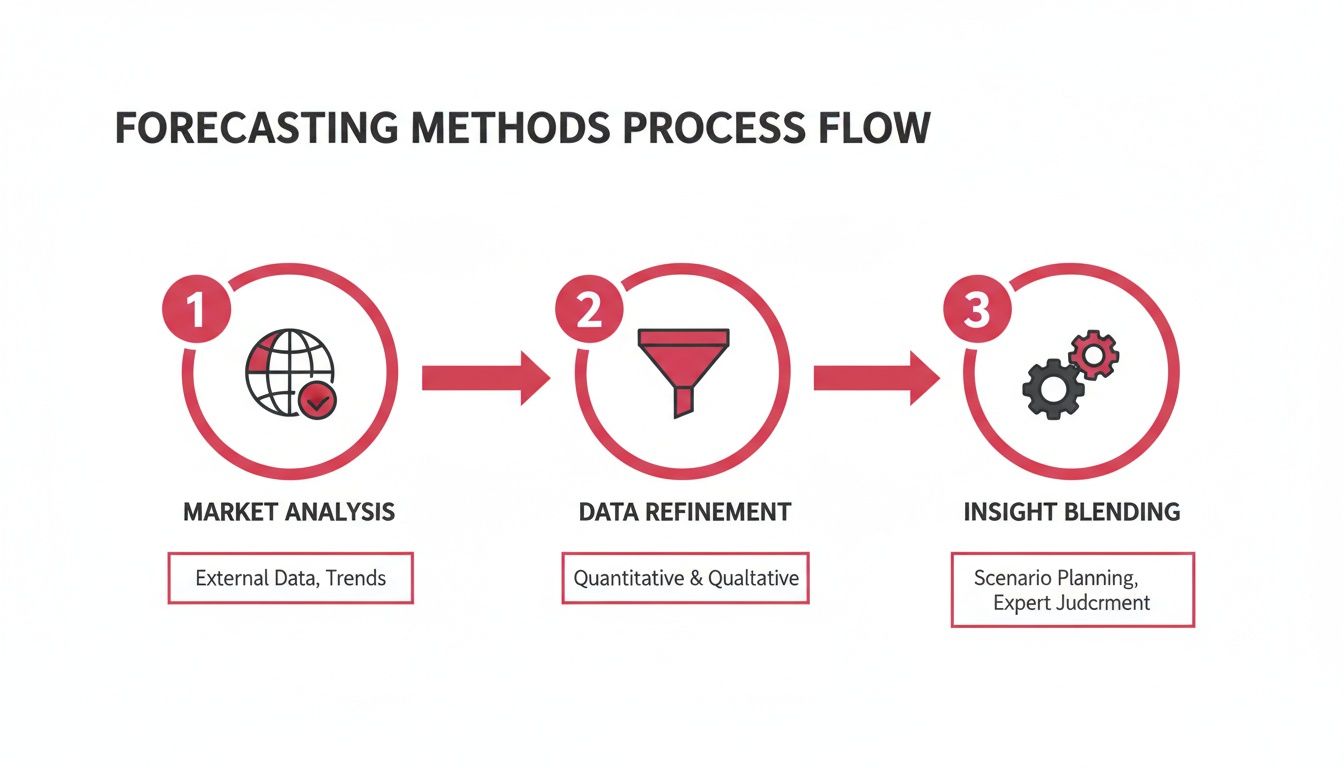
The best, most believable forecasts blend that high-level market context with the nitty-gritty details of your unit economics. This is where the rubber meets the road.
To help you get started, here's a quick overview of what each financial statement does and why it matters.
Core Components of Your Startup's Financial Model
| Financial Statement | Primary Purpose | Key Metrics to Track |
|---|---|---|
| Profit & Loss (P&L) | Measures profitability over a period (month, quarter, year). | Revenue, COGS, Gross Margin, Operating Expenses, Net Income |
| Cash Flow | Tracks the actual cash moving in and out of the business. | Cash from Operations, Cash from Investing, Cash from Financing, Net Change in Cash |
| Balance Sheet | Provides a snapshot of financial health at a single point in time. | Assets (Cash, Accounts Receivable), Liabilities (Accounts Payable, Debt), Equity |
This table is your cheat sheet, but let's dig into what building each of these really looks like for a founder.
The Profit And Loss Statement: Your Performance Scorecard
The Profit and Loss (P&L) statement, sometimes called the Income Statement, is usually the first stop for founders. It’s the clearest indicator of your company's profitability over a set period—be it a month, a quarter, or a full year.
The formula is simple: Revenue – Expenses = Net Income (or Loss). It answers the fundamental question: Is this business model working? Are we actually making more than we're spending?
Here’s what you’ll be piecing together:
- Revenue Projections: This is your top line, built from the bottom-up drivers we established earlier. Think: website visitors x conversion rate x average customer value.
- Cost of Goods Sold (COGS): These are the direct costs tied to delivering your product. For a SaaS business, this means things like server hosting, third-party API fees, or any software licenses crucial to your service.
- Gross Profit: Simply your Revenue minus COGS. This number is huge because it shows how much profit your core product generates before you account for all the other costs of being in business.
- Operating Expenses (OpEx): All the other stuff. OpEx covers the costs to run the company that aren't directly part of the product itself, like salaries, marketing campaigns, office rent, and software subscriptions.
The P&L gives you a fantastic view of profitability, but it has one massive blind spot: it isn’t tracking cash. For example, you might book a $12,000 annual contract in January and it looks great on the P&L. But if that client is paying you $1,000 a month, your cash reality is completely different.
The Cash Flow Statement: Your Startup Survival Guide
And that brings us to the most important document for any startup: the Cash Flow Statement. While your P&L can tell you if you're profitable on paper, the Cash Flow Statement tracks the actual cash moving in and out of your bank account. It is the ultimate survival guide.
Investors obsess over the Cash Flow Statement for one reason: it answers the most important question for any startup—"When do you run out of money?" Profitability is a nice goal, but positive cash flow is what keeps the lights on.
Building it means taking the net income from your P&L and adjusting it for all the things that aren't cash, while also tracking money from investors or loan payments.
It’s typically broken into three parts:
- Cash Flow from Operations: This starts with your Net Income and adjusts for things like accounts receivable (money customers owe you) and accounts payable (money you owe suppliers).
- Cash Flow from Investing: This section tracks cash spent on big-ticket items meant to last, like new computer equipment or property.
- Cash Flow from Financing: Here, you’ll record cash infusions from investors (like a seed round) or cash used to pay back debt.
The final number—the Net Change in Cash—tells you precisely how much your cash balance went up or down. This is the metric that dictates your runway.
The Balance Sheet: A Snapshot Of Financial Health
Finally, the Balance Sheet gives you a snapshot of your company’s financial standing at a specific moment in time. It’s built on one unbreakable rule: Assets = Liabilities + Equity.
- Assets: Everything your company owns that has value (cash in the bank, equipment, money owed to you).
- Liabilities: Everything your company owes to others (loans, supplier bills).
- Equity: The value left over for the owners and investors (investment capital, retained earnings).
The Balance Sheet is the ultimate fact-checker for your model. It pulls everything together, connecting your P&L (through retained earnings) and your Cash Flow Statement (through the final cash balance). If your Balance Sheet doesn't balance, it’s a flashing red light that you've made a mistake somewhere.
Putting these three statements together from scratch can feel like a heavy lift. This is where a well-designed template can be a lifesaver. You can check out a powerful startup financial projections template to see how these documents are built and linked in a practical format. A good template lets you focus on your assumptions, not on wrestling with spreadsheet formulas.
Remember, these statements don’t live in a vacuum. Your P&L’s net income feeds directly into your Cash Flow Statement and your Balance Sheet. The ending cash balance on your Cash Flow Statement becomes the starting cash on your next Balance Sheet. It's this beautiful, interconnected system that makes your financial model a dynamic and powerful tool for guiding your startup.
Stress-Testing Your Model with Scenario Analysis
You’ve built your three core financial statements. It feels like you should be done, right? Not quite. A static forecast is a fragile one. The real world is messy and unpredictable, and your model needs to be ready for it. This is where you elevate your forecast from a simple prediction into a powerful tool for managing risk.
The key is to stress-test your assumptions through scenario and sensitivity analysis. It's all about asking the tough "what if" questions to pinpoint where your business is most vulnerable to change. This isn't just an academic exercise; it's exactly the kind of strategic foresight an experienced operator like Robbie LaMattina would use to navigate market shifts or get ahead of new regulations.
Defining Your Best, Base, and Worst-Case Scenarios
The best way to start is by creating three distinct versions of your forecast. Each one paints a different picture of the future, built by tweaking the key assumptions you worked so hard to define.
-
The Base Case: This is your most likely, realistic path forward. It's built on the defensible, well-researched numbers you’ve already established. Think of this as your "plan of record."
-
The Worst Case: This is your "break glass in case of emergency" model. What happens if your main marketing channel gets 20% more expensive? What if customer churn suddenly jumps by 10%? This version tells you exactly how much runway you'd have if things go sideways.
-
The Best Case: This is your optimistic—but still plausible—scenario. What if a new feature goes viral and doubles your organic traffic? What if your trial-to-paid conversion rate ticks up by 5%? This helps you plan for scaling and shows where to double down if things go exceptionally well.
This isn't about making three random guesses. It's a disciplined exercise in quantifying risk and opportunity. It’s how you prepare for uncertainty instead of just reacting to it.
This structured approach forces you to get real about the levers in your business and how they directly impact your cash flow.
Identifying Your Most Sensitive Drivers
As you build out these different scenarios, you’ll quickly notice that not all assumptions are created equal. A 5% change in one input might barely move the needle, while the same change in another could completely change your financial outlook. That’s sensitivity analysis in a nutshell.
Your goal is to find the 2-3 variables that have the most dramatic impact on your bottom line. For most startups, these usual suspects often include:
- Customer Acquisition Cost (CAC)
- Customer Churn Rate
- Key Conversion Rates (like visitor-to-trial or trial-to-paid)
Once you know which drivers are most sensitive, you know where to focus your energy. If a small increase in CAC demolishes your profitability in the model, that's a blinking red light telling you to diversify your marketing or get obsessive about optimizing ad spend. While spreadsheets work, exploring specialized data analysis tools for financial forecasting and scenario planning can make this process faster and far more robust.
From Static Numbers to Strategic Conversations
Ultimately, scenario planning is about much more than a spreadsheet. It completely changes the conversations you have, both with your team and with investors.
Instead of presenting a single, rigid forecast, you can walk into a meeting and say, "Here's our base plan. If we hit a snag and churn increases to X, we have a plan to cut costs here and extend our runway by three months. On the flip side, if our new campaign takes off, here's how we’ll reinvest that capital to accelerate growth."
This level of preparation shows you have a deep, realistic understanding of your business and instills serious confidence. So many startups aim for the moon, forecasting 522% growth in year one. But reality bites. With the startup failure rate hovering around 90%, those hockey-stick projections that ignore the cold, hard numbers are a recipe for disaster.
This is how you move from hopeful guessing to true strategic planning.
Presenting Your Forecast to Win Over Investors
You’ve spent countless hours building a financial model you can stand behind. That’s the hard part, right? Well, almost. A complex spreadsheet won't win over investors on its own—a compelling story backed by those numbers will. Your final job is to translate all that detailed work into a clear, credible narrative that sells your vision and proves you have a firm grip on the realities of building a business.

Investors see hundreds of forecasts. They can spot fluff and wildly optimistic projections from a mile away. Your goal here is to build immediate trust by showing you understand your business inside and out.
From Spreadsheet to Storytelling
An investor pitch is not the time for a line-by-line walkthrough of your Excel model. What you need is a high-level summary—a dashboard that tells your story at a glance. It should be clean, visual, and laser-focused on the key performance indicators (KPIs) that actually drive the business.
Investors aren't just investing in your numbers; they're investing in your ability to understand and execute on those numbers. Your presentation is a test of your command over your own business model.
A great financial dashboard instantly answers an investor's most critical questions by highlighting metrics like:
- Customer Lifetime Value (LTV): What’s a customer truly worth to us over time?
- Customer Acquisition Cost (CAC): How much do we have to spend to get that customer?
- LTV to CAC Ratio: Is the core of our business model profitable and scalable?
- Monthly Burn Rate: How much cash are we actually spending each month?
- Runway: Based on our burn, how many months do we have before we run out of money?
Leading with these KPIs shows you speak their language and are obsessed with building a sustainable company, not just a cool product.
Defending Your Numbers with Confidence
Remember that every number in your forecast is an assumption. You absolutely must be prepared to defend each one. This is where all that hard work on your bottom-up build really pays off.
When an investor inevitably asks, "How did you get to this revenue number?" you won't be left fumbling.
Instead, you can answer with total confidence: "Our revenue projection is based on hitting 10,000 monthly website visitors, converting 3% of them to a free trial, and then converting 25% of those trials into paying customers at $50 per month. We based these conversion rates on our early user data and established industry benchmarks for our sector."
That kind of answer demonstrates a clear, logical thought process—a quality that seasoned operators like Robbie LaMattina stress is essential for building businesses that can scale.
Avoiding Credibility-Killing Mistakes
I’ve seen too many promising startups stumble during the pitch because of common, easily avoidable mistakes in how they present their financials. Be on the lookout for these red flags:
- The Unjustified "Hockey Stick": Everyone loves to show exponential growth, but it has to be rooted in reality. If you're projecting a massive spike in revenue, you’d better have a clear, funded plan for a corresponding massive increase in marketing spend or sales hires to make it happen.
- A Messy or Confusing Model: If an investor asks to see the full spreadsheet (and they might), it needs to be clean, well-organized, and easy for them to follow. A messy model implies messy thinking.
- Ignoring Cash Flow: Focusing only on your P&L and when you’ll hit profitability is a classic rookie mistake. Investors are obsessed with cash flow and runway. It’s what keeps the lights on.
A strong financial model is a cornerstone of your pitch, but it's often part of a much larger narrative. To see how these numbers fit into the bigger picture, it helps to understand how to write a comprehensive business plan.
In a world where an astounding 99% of executives admit that bad forecasts have damaged their companies, getting this right is non-negotiable. Your financial forecast isn’t just a set of numbers; it's the foundation of your credibility. When you can connect that solid model to a great story, you become unstoppable. For help structuring that story, check out this excellent venture capital pitch deck template.
Frequently Asked Questions About Financial Forecasting
How far out should I forecast for my startup?
For early-stage startups, a detailed, month-by-month forecast covering 18 to 24 months is the standard. This timeframe is long enough to show investors your operational plan and key milestones but short enough to remain reasonably grounded. It's also common to include a higher-level, annual forecast for years three through five to illustrate your long-term vision.
What is the best software for financial modeling?
Most founders start with spreadsheets like Excel or Google Sheets because they are free and flexible. As the business grows, dedicated Financial Planning & Analysis (FP&A) software like Fuelfinance or Causal becomes a better option. These tools automate data entry by syncing with accounting software and make scenario planning much easier. Enterprise-level platforms like NetSuite or Oracle are generally overkill for a startup.
How often should I update my financial forecast?
Your forecast is a living document and should be reviewed and updated monthly. This involves a "budget vs. actuals" analysis where you compare your projections against your real performance. This regular check-in ensures your model stays tethered to reality and helps you make agile decisions to manage your cash runway effectively.
What is the biggest mistake founders make in financial forecasting?
The most common mistake is creating a forecast detached from reality, often seen in the "hockey stick" projection. This happens when growth is shown without a credible, funded plan to achieve it. A forecast should be a strategic tool built from the bottom up, grounded in defensible unit economics, and used to steer the business—not just a sales document for investors. Insights from operators like Robbie LaMattina emphasize that a realistic, data-driven model builds far more credibility.
At Robert LaMattina, we're obsessed with helping founders build on a solid financial foundation. The insights here are designed to give you the practical tools you need to build a resilient business and navigate the inevitable challenges of growth. You can find more actionable strategies for entrepreneurs at https://robertlamattina.net.