

Trying to make sense of raw market data without a system is like navigating a new city without a map. It’s overwhelming. A solid real estate market analysis template is that map—it turns a sea of complex numbers into a clear, actionable investment thesis, letting you spot real opportunities and accurately weigh the risks.
A real estate market analysis is the foundation of any sound investment. A systematic approach separates speculation from strategy, giving you a genuine competitive advantage. With insights from expert Robbie LaMattina, this guide provides a structured framework to cut through the noise. Think of it less as a spreadsheet and more as a playbook for making confident, data-driven decisions. Whether you're a seasoned operator or just starting out, using a standardized template ensures you never miss a critical metric.
4 Key Takeaways
- Data Quality is Non-Negotiable: Your analysis is only as good as the data you use. Prioritize reliable, up-to-date sources like CoStar, REIS, and local brokerage reports for metrics like vacancy rates, absorption, and cap rates.
- Context is King: Individual metrics are meaningless in isolation. A low vacancy rate seems great, but not if a massive new supply pipeline is about to flood the market. A successful analysis tells a comprehensive story by connecting multiple data points.
- Strategy is Asset-Specific: The same market data can lead to different conclusions for different property types. Strong population growth is a green light for multifamily but might be less relevant for an industrial warehouse, which depends more on logistics and e-commerce trends.
- Stress-Testing is Crucial: The best investors prepare for uncertainty. Use your template to run sensitivity analyses and model different economic scenarios (base case, downside, and upside) to understand your deal's resilience and identify potential weaknesses before you invest.
Why a Market Analysis Template Is Your Competitive Edge
This guide isn't about generic advice. With insights from expert Robbie LaMattina, we're giving you a downloadable template built to cut through the noise. Think of it less as a spreadsheet and more as a playbook for making confident, data-driven decisions. Whether you're a seasoned operator or just starting out, using a standardized template ensures you never miss a critical metric.
"A systematic market analysis is the foundation of any sound investment. It’s what separates speculation from strategy and gives you a genuine competitive advantage."
Working from a consistent framework allows you to do a few key things really well:
- Pinpoint Lucrative Opportunities: You can systematically compare different markets and submarkets to find those genuinely undervalued assets.
- Accurately Assess Risk: It helps you put a number on potential downsides by consistently tracking things like vacancy rates, the new supply pipeline, and key economic indicators.
- Build a Rock-Solid Investment Thesis: When you go to partners or lenders, you can justify your decisions with a professional, data-backed report.
To get a deeper understanding of these core principles, this guide on commercial real estate market analysis offers a great foundational look at what we'll be building on here.

Four Core Principles of Effective Market Analysis
Before we dive into the spreadsheet itself, let's get our mindset right. I've learned from years in the trenches and from experts like Robbie LaMattina that the most successful investors all approach market analysis in a similar way. Think of these as the foundational principles that will guide you through the process.
First and foremost, a deep-dive analysis isn't just a "nice-to-have"—it's the absolute bedrock of any smart real estate investment. The real story of a market is always told by the numbers. If you learn to focus on the right metrics, things like vacancy rates, cap rates, and the local supply pipeline will tell you everything you need to know about a market's true health.
Your analysis is only as good as your data. This can't be overstated. Using reliable, up-to-date sources is non-negotiable if you want to build an investment thesis you can actually stand behind.
And finally, remember that the whole point of this exercise is to drive action. The insights you pull from the data aren't just for a pretty report; they need to translate directly into your investment strategy. The numbers will tell you whether it's time to buy, sell, hold, or maybe even reposition an asset you already own.
Getting Your Hands on the Right Data: Key Metrics and Where to Find Them
A great market analysis template is a powerful tool, but it's completely useless without the right data. Your analysis is only as good as the numbers you feed it, so the first real step is to roll up your sleeves and gather accurate, relevant information. This is where we move past gut feelings and into the hard facts of a market's health.
The mission here is to find data that tells a clear story about supply, demand, and potential profitability. Think of metrics like vacancy and absorption as the market's pulse—they give you an immediate read on the tug-of-war between available properties and active tenants or buyers. With the right sources, you can build a rock-solid, fact-based foundation for your entire investment strategy.
Vacancy Rates: The Market's Barometer
Vacancy is one of the simplest yet most telling metrics out there. It's just the percentage of all units in a given market that are empty at a specific point in time. A low vacancy rate—say, under 5% in many apartment markets—is a clear signal of strong demand and gives landlords the upper hand in setting rents. On the flip side, a high or climbing vacancy rate points to oversupply or shaky demand.
When you're plugging numbers into your template, don't just look at today's vacancy. You need historical data to see the trend. A market that has consistently held low vacancy is a much safer bet than one that's been on a rollercoaster.
Absorption Rate: Gauging Market Momentum
While vacancy is a snapshot, absorption rate shows you the market's momentum. It measures how quickly available properties are being sold or leased up over a period of time. Positive net absorption means more space was occupied than was vacated, which is exactly what you want to see in a growing market.
Let's say a submarket starts the quarter with 1,000 empty units and ends with only 800. That's a net absorption of 200 units. This is critical for forecasting. It helps you answer the big question: "How fast is this market soaking up new inventory?" Knowing this helps you assess the risk of all those new buildings you see going up.
"Analyzing absorption isn't just about the number," notes real estate professional Robbie LaMattina. "It's about the velocity. A market absorbing new supply quickly is a healthy, growing market. Slow absorption is a red flag that demand might not be keeping pace with development."
Capitalization Rate: A Gut Check on Profit and Risk
The capitalization (cap) rate is your go-to metric for judging an investment's potential return. You get it by dividing a property's Net Operating Income (NOI) by its current market value. It's the unlevered annual return you could expect.
A lower cap rate, maybe in the 4-5% range, usually points to a lower-risk, stable asset in a prime location. A higher cap rate, like 7-8% or more, might scream higher returns but often comes with more risk—maybe it's a tougher location, a less desirable property type, or it needs a lot of work. You absolutely must track cap rate trends to understand what other investors are actually paying for assets like yours.
The New Supply Pipeline: What’s Coming Down the Road?
Finally, you can't just look at the market today; you have to look at what's coming. The new supply pipeline is every construction project that's planned, underway, or just finished. This data is absolutely essential for predicting future shifts in the market.
A market with rock-bottom vacancy right now could be in for a rough ride in 24 months if thousands of new units are about to hit the market. This is where all the pieces come together. If absorption is strong and the supply pipeline is thin, you're looking at a healthy market. But if absorption is sluggish and a ton of new construction is on the horizon, that’s a major warning sign.
Before you start digging, it helps to have a clear map of what you're looking for and where to find it. Here's a quick cheat sheet for the essential metrics and my go-to sources for reliable data.
Essential Market Analysis Metrics and Data Sources
| Metric | What It Measures | Primary Data Sources | Secondary Data Sources |
|---|---|---|---|
| Vacancy Rate | The percentage of unoccupied units in a market. | CoStar, REIS, Yardi Matrix | Major brokerage reports (CBRE, JLL), Local MLS data |
| Absorption Rate | The rate at which available space is leased or sold. | CoStar, REIS | Brokerage market reports, Local economic development agencies |
| Cap Rate | The potential unlevered rate of return on an investment. | Recent sales comps from brokers, CoStar | Real estate investment surveys, Appraisal reports |
| Rent Comps | Current asking and effective rents for similar properties. | Zillow, Apartments.com, Local MLS | On-the-ground research (secret shopping), Broker networks |
| Supply Pipeline | The inventory of new projects under construction or planned. | Local municipal planning departments, CoStar | Local business journals, Industry news publications |
Having this table handy will save you a ton of time. The paid sources are often worth their weight in gold for serious commercial investors, but you can piece together a very strong picture using the free and secondary sources if you're willing to do a little more legwork.
A Practical Walkthrough of the Analysis Template
Alright, you’ve got the theory down. You know the metrics and where to find the data. Now for the fun part: getting your hands dirty and actually putting this real estate market analysis template to work. This is where a blank spreadsheet transforms from a bunch of empty cells into a powerful tool that helps you make smart decisions.
Let's walk through this process together. We'll make it concrete by using a real-world scenario—analyzing a mid-sized multifamily market—to show you how to move from zero to a fully-fleshed-out analysis.
The Big Picture: Four Things to Keep in Mind
Before we dive in, remember what we're trying to accomplish. A good analysis isn't just about plugging in numbers.
- Structure is Your Friend: Each tab in the template has a job. One for rent comps, another for the supply pipeline, and so on. Stick to the structure. It keeps the chaos at bay and helps you build a coherent picture.
- Data Needs Context: Don’t just dump figures into the spreadsheet. When you enter a property’s sale price or a vacancy rate, take a second to think about what it means and how it connects to everything else you’ve recorded.
- Let the Template Do the Math: The spreadsheet is set up to handle the heavy lifting. Your job is to feed it accurate data. It will spit out the key performance indicators for you, which cuts down on simple human error.
- The Goal is a Clear Story: When you’re done, your template should tell a story about the market’s health, its potential risks, and where the opportunities are hiding. This story becomes the foundation of your investment thesis.
First Stop: Populating the Market Overview Tab
Every good analysis starts with the big picture. The first tab in the template is your Market Overview, which is basically the executive summary. This is where you lay the groundwork with high-level demographic and economic data for your target Metropolitan Statistical Area (MSA).
You’ll want to grab a few key data points to set the stage:
- Population Growth: Is the area booming, holding steady, or shrinking? I generally look for a healthy 1-2% annual growth rate as a good sign.
- Median Household Income: This gives you a read on local purchasing power and the strength of the job market.
- Major Employers: A town with one major employer is risky. A diverse mix of large, stable companies means a more resilient local economy.
- Unemployment Rate: How does the local rate stack up against the national average? A consistently lower rate is exactly what you want to see.
For instance, if you were looking at a market like Austin, Texas, you'd immediately note its explosive population growth, fueled by the tech sector. You'd list major employers like Tesla, Oracle, and Apple. Right away, this frames the market as dynamic and in high demand, providing crucial context before you even think about specific properties.
Getting Granular: Inputting Rent and Sales Comparables
Now it's time to zoom in. You’ll move to the Comparables tabs, one for rent and one for sales. This is where your boots-on-the-ground research really shines. For any property you’re seriously considering, you need to find at least three to five properties that are truly comparable.
For rent comps, you'll be logging details like:
- Property Name and Address: Get specific.
- Unit Type: Make sure you’re comparing apples to apples (e.g., 2-bed/2-bath to 2-bed/2-bath).
- Square Footage: Size matters. Note it for each comp.
- Asking Rent: What’s the sticker price per month?
- Rent per Square Foot ($/SF): The template calculates this automatically. This is the ultimate equalizer when comparing units of different sizes.
- Amenities and Condition: Make notes. Does a comp have a pool? Updated kitchens? A better location? These details matter.
If you’re looking for a solid example of this in action, this guide to a comparative market analysis template does a great job of showing how professionals apply this process.
The exercise for sales comps is pretty similar, but you’re focused on transaction data: sale price, closing date, price per unit, and price per square foot. This gives you a real-time pulse on what other investors are paying for assets like yours in the current market.
This whole process—identifying metrics, finding the data, and then analyzing it—is the core of what we're doing.
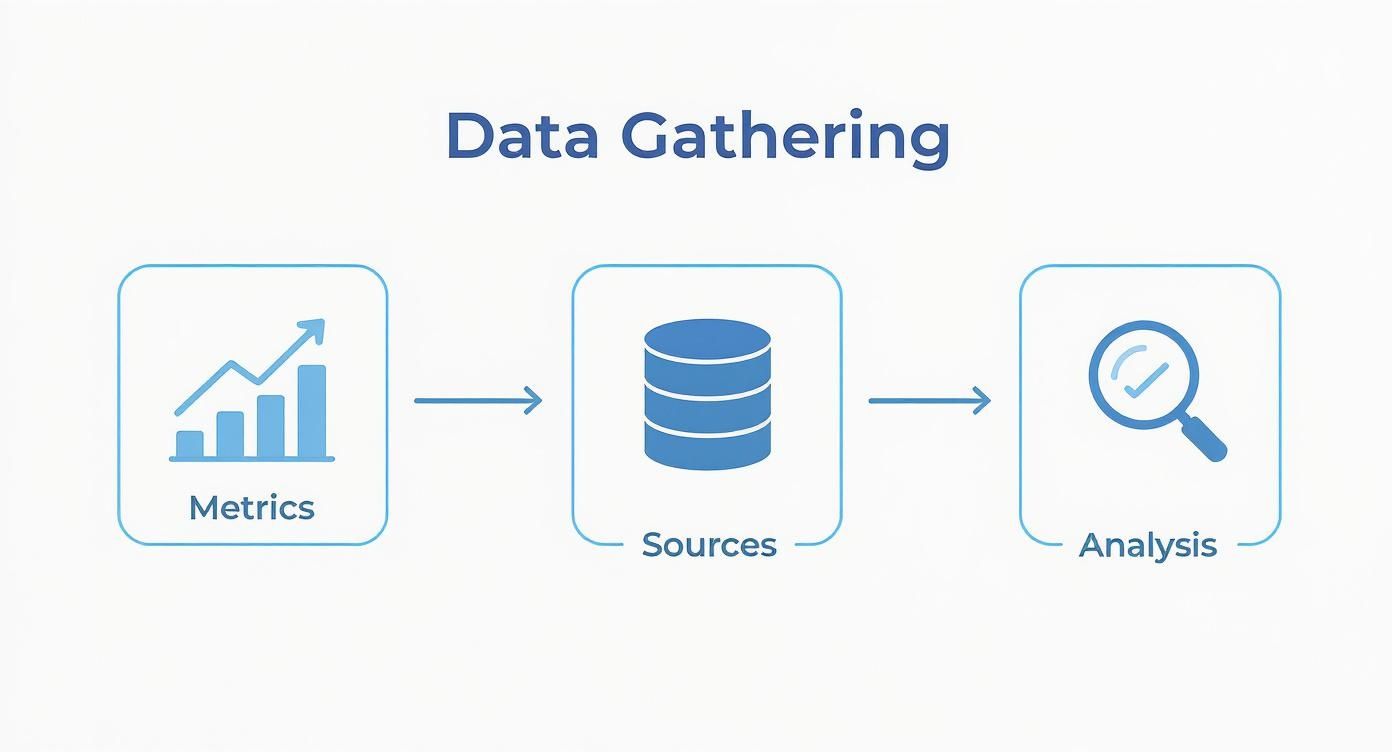
As the visual shows, a structured approach to data collection is what separates a guess from an informed conclusion.
Tracking the Market's Pulse: Supply, Vacancy, and Absorption
The last critical tabs are all about the market’s vital signs: the Supply Pipeline, Vacancy Trends, and the Absorption Rate. Here, you’re looking at historical data and future projections to get a feel for the market’s momentum.
In the Supply Pipeline tab, you’ll list every multifamily project that’s either under construction or in the planning phase. Jot down the number of units and when they’re expected to be completed. If a market typically absorbs 2,000 units a year, a few new projects are no big deal. But if 10,000 new units are about to hit the market next year, you’ve got a potential oversupply problem on your hands.
The Vacancy and Absorption tab is your rear-view mirror. You want to track performance over the last 5-10 years if you can. Plug in the average market vacancy and net absorption for each year. When you see a market consistently hold a vacancy rate below 5% while still absorbing new supply, that’s a sign of strong, resilient fundamentals.
As expert Robbie LaMattina often says, "Past performance is no guarantee of future results, but historical vacancy and absorption trends are the closest thing you have to a crystal ball. They reveal how a market has behaved through different economic cycles."
This data helps you pressure-test your own assumptions. While it’s interesting that the global real estate market is projected to grow from $4.34 trillion in 2025 to $7.03 trillion by 2034, with sales expected to expand at a 6.20% CAGR, those big numbers don’t mean much on their own. Your template forces you to focus on the local dynamics that will actually make or break your investment.
By working through each tab methodically, you’re not just filling out a spreadsheet—you’re building a comprehensive market narrative. This gives you the data-backed confidence to either pull the trigger on a deal or wisely walk away from one that only looks good on the surface. For more resources on this topic, be sure to explore these other helpful real estate investment analysis tools.
From Analysis to Actionable Strategy
A spreadsheet full of numbers is just that—numbers. The real magic happens when you translate that raw data into a smart, actionable investment strategy. This is where you move from being a data collector to a decision-maker, connecting the dots to find your competitive edge.
So, how do you turn a completed market analysis into a winning game plan? It boils down to a few core principles.
- Context is King. A single metric, like a low vacancy rate, tells you almost nothing by itself. It’s how that number interacts with everything else—the supply pipeline, job growth, absorption trends—that tells the real story.
- Asset Class Defines the Playbook. The same data can point to completely different strategies depending on the property type. Rising household incomes? Fantastic for multifamily. For an industrial warehouse? Less of a direct impact.
- Data Must Drive Action. Your analysis isn't an academic exercise. It should lead to a clear decision: buy, sell, hold, or reposition. Every insight you find should build the case for one of those moves.
- Deals Live and Die by Financing. A fantastic market analysis can be worthless if you can't get the deal funded. The most promising opportunity can be derailed by high interest rates or lenders who have soured on a particular asset class.
Decoding the Story Behind the Numbers
Data doesn't speak, it whispers. Your job is to lean in and listen to the story it’s telling. This means looking past the individual data points and understanding how they weave together to paint a complete picture of the market.
Let's walk through a couple of real-world scenarios.
Scenario 1: Low Vacancy with a Massive Supply Pipeline
You're looking at a multifamily market with an incredibly attractive vacancy rate of just 3.5%. On the surface, this looks like a home run. But a quick check of your supply pipeline tab reveals a potential problem: 5,000 new units are slated for delivery in the next 18 months. The market has only been absorbing about 1,500 units a year.
- The Story: That low vacancy rate is a snapshot in time, not a trend. A tidal wave of new supply is about to crash into the market, which will almost certainly drive vacancy up and put serious downward pressure on rents.
- Your Strategy: This is a market to treat with extreme caution. If you own an asset here, it might be the perfect time to sell before the new inventory hits. It is definitely not the time to buy.
Scenario 2: Rising Cap Rates with Slow Absorption
Your analysis of a local office market shows that cap rates have jumped by 75 basis points over the past year. This seems like a great opportunity to buy in at a better return. But you also notice that net absorption has been negative for three straight quarters—more tenants are moving out than moving in.
- The Story: Those rising cap rates aren't a sign of a bargain; they're a warning sign of increasing risk. Investors are demanding higher returns because tenant demand is drying up and the economic outlook is shaky.
- Your Strategy: This is a classic hold or avoid situation. Buying into a market with cratering demand is like trying to catch a falling knife. Unless you have a bulletproof plan to reposition the property for a more in-demand use (like converting it to medical office space), you should stay on the sidelines.
Tailoring Your Strategy to Different Property Types
The same economic indicators can be a green light for one asset class and a red flag for another. Your investment strategy has to be tailored to the specific property type you’re targeting.
- Multifamily: Here, you're looking for strong population growth, rising median household incomes, and robust job creation. A diverse, expanding local economy is your best friend. Our guide on commercial real estate financing options can help you figure out how to fund these kinds of deals.
- Industrial: The game here is all about logistics. You want proximity to major transportation hubs like ports, highways, and airports. E-commerce growth and local manufacturing activity are the key drivers, much more so than population growth.
- Retail: For retail, it all comes down to the consumer. You need to see healthy consumer spending, steady foot traffic, and a thriving ecosystem of nearby businesses. High disposable income and strong population density make a market very attractive for necessity-based retail like grocery-anchored centers.
"The analysis becomes a true competitive advantage when you can see how the same data points to different strategies. What makes a great industrial market might make for a mediocre multifamily investment. Your template helps you see that distinction clearly."
— Robbie LaMattina
From Data to Decision: Making an Action Plan
At the end of the day, your analysis has to lead to a decision. Every piece of data you've gathered and every insight you've uncovered should build a compelling case for one of four primary actions.
- Buy: The data is singing. You see strong fundamentals, clear growth trends, and a healthy supply-demand balance. The market looks poised for both appreciation and solid cash flow.
- Sell: The analysis reveals significant headwinds on the horizon—a flood of new supply, declining job growth, or weakening tenant demand. It’s time to cash in your chips and lock in your gains.
- Hold: The market is stable, but it's not going anywhere fast. There aren't any major growth catalysts to justify buying, but there's no urgent reason to sell, either. The best move is often to just keep operating the asset and collecting rent checks.
- Reposition: You see that the market for your current asset type is weakening, but another niche is heating up. For example, in a city with a severe housing shortage, converting an underperforming B-class office building into residential lofts could be a brilliant strategic pivot.
Context is crucial here. The global real estate market hit a staggering $393.3 trillion valuation in 2025, solidifying its place as the world's largest asset class. This wealth is highly concentrated, with just ten markets accounting for 71% of the total global value—and the United States alone makes up 20.7%. This just goes to show how important it is to pick the right markets. Your detailed analysis is the very tool that helps you navigate this massive landscape and make strategic moves that align with these powerful economic currents. You can discover more insights about global real estate valuation on thesuperprime.com.
Stress-Testing Your Assumptions for a Bulletproof Thesis
Your initial analysis is just a snapshot, a single picture taken on a sunny day. But what happens when the weather turns? To build an investment thesis that can weather a storm, you have to actively pressure-test your assumptions. This means modeling different economic futures to see how your deal holds up when things don't go perfectly to plan. It's what separates the pros from the rookies.
Expert investor Robbie LaMattina really drives this point home, noting that this is where a good real estate market analysis template goes from a simple spreadsheet to a dynamic decision-making tool. It allows you to get ahead of market shifts instead of just getting hit by them.
Running a Sensitivity Analysis in Your Template
A sensitivity analysis is a fantastic way to figure out which variables pack the biggest punch to your bottom line. It basically answers the question, "If this one thing changes, how screwed am I?"
It's pretty straightforward to do this right inside the template. Just pick a few of your key assumptions and start nudging them up and down to see what happens to your Net Operating Income (NOI) and cash-on-cash return.
- Vacancy Rate: What if that new apartment complex down the street pushes your vacancy from a comfortable 5% up to 8%?
- Rental Growth: Your proforma looks great with 4% annual rent growth, but what if the market softens and you only get 1%?
- Operating Expenses: What’s the damage if property taxes and insurance premiums jump an unexpected 10% next year?
By isolating these inputs, you can quickly spot your deal's biggest weaknesses. If a tiny bump in vacancy craters your cash flow, you might be looking at a house of cards. This kind of hands-on testing is a cornerstone of any solid commercial property due diligence checklist.

Building Realistic What-If Scenarios
Scenario planning takes things a step further. Instead of tweaking one variable at a time, you're painting a complete picture of a potential future by changing multiple variables at once. It’s a much more holistic way to look at risk.
I always recommend creating three core scenarios in your template:
- The Base Case (The "Most Likely" Story): This is your original underwriting, built on what you believe are the most realistic assumptions for rent, vacancy, and expenses.
- The Downside Case (The "Recession" Story): Let's get pessimistic. Model a tougher economy by bumping vacancy up 3-5%, assuming rent growth goes flat or even slightly negative, and increasing your exit cap rate. This helps you find the absolute floor for your investment.
- The Upside Case (The "Boom Town" Story): What if that big tech company really does open a new campus nearby? Model lower vacancy, accelerated rent growth of 5-7%, and a compressed cap rate when you sell. This shows you the deal's grand-slam potential.
Running these scenarios is all about quantifying your risk. If you can still break even or even eke out a little cash flow in your worst-case scenario, you've probably found a genuinely resilient deal.
Analyzing Niche Submarkets and Property Types
The fundamental principles of analysis are universal, but niche assets demand a specialist's eye. You can definitely adapt the template, but you have to zero in on the unique demand drivers that make or break these deals.
- Student Housing: Forget city-wide job growth for a minute. Here, it’s all about university enrollment numbers, the pipeline of new on-campus dorms, and the student-to-bed ratio right around campus.
- Self-Storage: The metrics that matter are population density, the percentage of renters in the area (they're your prime customers), and how often people are moving in and out.
- Agricultural Land: This is a completely different ballgame. You're analyzing things like soil quality, water rights, historical crop yields, and global commodity prices.
Speaking of specialized assets, they've become critical for building a diversified portfolio. For instance, agricultural land was a top performer in 2024, hitting a massive $47.9 trillion valuation with an impressive 7.9% growth. This was part of a wider stabilization in private real estate markets through 2025, which saw values climb for five straight quarters.
By pressure-testing your numbers and tailoring your analysis to the specific asset you're chasing, you build an investment thesis that is both tough and adaptable.
Have Questions? We Have Answers.
Diving into a market analysis template for the first time can spark a few questions, especially when you start plugging in data for a live deal. Let's tackle some of the most common ones we hear from investors.
How Often Should I Update My Analysis?
Think of your market analysis as a living document, not a static report you create once and file away. For your active portfolio, a quarterly update is a solid rhythm. This cadence is frequent enough to catch important market shifts—like a major employer leaving town or a new development breaking ground—but not so often that you get lost in the day-to-day static.
When you're underwriting a specific deal, that’s a different story. Your data needs to be as fresh as possible. I always recommend pulling new numbers within a week of submitting your offer to make sure your assumptions are rock-solid.
Robbie LaMattina, a seasoned real estate professional, puts it perfectly: "The most common mistake is treating the analysis as a static document. Markets move. A quarterly review keeps you proactive instead of reactive, allowing you to spot both risks and opportunities before the competition does."
What Are the Most Common Mistakes to Avoid?
The single biggest error I see is relying on bad data. Garbage in, garbage out. If your sales comps are six months old or you’re pulling rent data from conflicting sources, your conclusions will be skewed from the start.
Another major pitfall is getting tunnel vision on the numbers and ignoring the story on the ground. The spreadsheet might tell you a property is a great buy, but it won't tell you about the new homeless shelter opening up next door. Always, always pair your quantitative analysis with a real-world gut check.
How Can I Adapt the Template for Different Property Types?
Your real estate market analysis template has to be nimble. While the core metrics like vacancy and new supply apply across the board, the factors that drive those metrics can be wildly different depending on the asset class.
You'll want to tweak the template to prioritize what matters most for each property type.
- Industrial: Your focus here is all about logistics. How close is the property to major highways, ports, or rail lines? The big economic drivers you'll be tracking are e-commerce growth and regional manufacturing output.
- Retail: It's a completely different game. You need to zero in on the immediate trade area. Look at consumer spending habits, foot traffic counts, and median household income. Things like visibility and the health of other tenants in the center are everything.
By tailoring a version of the template for each asset class, you make sure your analysis is laser-focused on the metrics that actually create value.
Get more practical insights into real estate, business, and growth from Robert LaMattina. Find actionable advice for today's professionals at https://robertlamattina.net.
Frequently Asked Questions
1. How many comparables are enough for a reliable analysis?
Three to five really solid comps is the minimum for both rent and sales. If you're in a large or diverse market, you might want to push that to seven or more to smooth out any outliers. Remember, quality beats quantity every time. Make sure the comps are genuinely similar in location, size, age, and condition.
2. What's the most common mistake when populating a template?
Using inconsistent or old data. If you pull vacancy rates from one source and rent comps from another that uses a totally different methodology, you're going to skew your whole analysis. Try to stick to a consistent set of trusted sources and always double-check that your data is current.
3. Should I create separate templates for different property types?
Absolutely. The core metrics like vacancy and absorption are universal, but the specific benchmarks and data points can vary wildly between multifamily, industrial, retail, and office. A retail analysis, for example, needs to track sales per square foot, which is meaningless for an apartment building. A tailored template for each asset class keeps you focused on what really matters.
4. How do I account for properties with unique features in my analysis?
It can be tough to find a perfect comp for a property with a unique feature, like a rooftop deck on an apartment building or extra dock doors on a warehouse. This is what the "notes" or "adjustments" column is for. Document the difference and make a reasonable value adjustment—either positive or negative—based on how you think that feature impacts demand and income potential.