

Think of a startup financial projections template as less of a spreadsheet and more of a financial roadmap. It’s a tool that translates your vision—your big idea—into a concrete, numbers-driven plan. This is exactly what you need to make smart decisions, manage your growth, and, most importantly, secure funding. This guide, drawing on insights from experts like Robbie LaMattina, will walk you through building a financial story that investors will actually believe.
Our template is built on the same principles used by seasoned pros, providing a solid framework to help you craft a financial story that investors will actually believe.
Your Financial Blueprint for Startup Success
Let’s be honest: a well-built financial model is probably the single most important document you'll create as a founder. It’s your command center. You'll use it when you're pitching VCs, asking a bank for a loan, or just trying to figure out if you can afford that new hire.
A lot of founders get hung up on the numbers, but building a forecast is more about logical storytelling than it is about being an accountant.

My goal here is to pull back the curtain on financial forecasting and give you a tool that feels powerful, not intimidating. To get a feel for what’s out there, it's worth checking out different examples of a financial projections template Excel to see how various models are put together.
Understanding the Core Financial Statements
At the center of every financial model are three key reports. They don’t work in isolation; they connect to tell the full story of your startup’s financial health and where it’s headed.
- The Income Statement (P&L): This is all about profitability. It lines up your revenue against your expenses to show whether you’re making or losing money over a specific period.
- The Cash Flow Statement: This tracks the real cash moving through your business. It's the ultimate reality check and answers the most critical question: "How much runway do we have?"
- The Balance Sheet: This is a snapshot in time. It shows what your company owns (assets), what it owes (liabilities), and what’s left over for owners (equity).
I've seen so many founders fixate on the P&L, celebrating "profitability" while their bank account is draining. A business can be profitable on paper but go under because customers pay late or inventory costs are too high. That's why cash is king, and the Cash Flow Statement is your lifeline.
These three statements need to talk to each other to create a believable story. For instance, your Income Statement might show aggressive revenue growth, but it's the Cash Flow Statement that proves you have the cash on hand to actually support that growth. Investors will dig into these connections to see if you truly understand the financial engine of your business.
Four Key Takeaways from This Financial Projections Guide
Before we get into the weeds of the spreadsheet, let's zoom out. What really matters here? Think of this as the high-level strategy—the core principles that turn a bunch of numbers into a powerful story for growth and fundraising.
I've built this guide around four game-changing ideas, drawing on insights from experts like Robbie LaMattina. Internalize these, and you'll be way ahead of the curve.
Master the Assumptions
Your 'Assumptions' tab is the heart of your entire financial model. It's not just a list of guesses; it's the engine driving everything else. Every single number, from your first dollar of revenue to your last payroll expense, needs to trace back to a clear, logical assumption you can defend.
Build a Revenue Forecast from the Ground Up
Next, we’ll focus on building a revenue forecast that’s actually believable. Forget the generic "hockey stick" curve that every founder slaps into their pitch deck. A credible model is built from the bottom up, tying revenue directly to real-world drivers like your marketing budget or your sales team's quota. This is absolutely critical when you're figuring out how to raise seed funding and have investors poking holes in your plan.
A huge mistake I see all the time is building projections based on hope. A strong forecast is a story backed by data. If you’re claiming 20% month-over-month growth, you better be able to show the math on ad spend, sales hires, or conversion rates that makes it happen.
Cash Flow is King
We're also going to get serious about managing your cash flow. Being profitable on paper is nice, but it means absolutely nothing if your bank account hits zero. This guide puts a heavy emphasis on the Cash Flow Statement to help you sidestep the common pitfalls that sink otherwise solid startups.
Finally, you’ll learn the art of scenario analysis. By creating best, base, and worst-case models, you're not just guessing—you're preparing. It shows investors you’re a strategic thinker who is ready for anything, not just the sunny-day outcome. These four pillars are the foundation for building a financial model that does its job: guiding your business to success.
Introduction to Building Your Projections
Now that you understand the high-level strategy, it's time to roll up your sleeves. The following sections will guide you step-by-step through the practical process of building your financial projections. We'll start with the most crucial element—your assumptions—and then move through forecasting revenue, mapping out expenses, and finally, analyzing the results. This is where your strategic vision meets the spreadsheet.
Building Your Projections From the Assumptions Tab
Every credible financial model I've ever seen is built on a foundation of solid, defensible assumptions—not on fancy formulas. The "Assumptions" tab in any good startup financial projections template is where your business strategy gets translated into hard numbers. Think of it as the engine of your entire forecast.
Getting this part right is the difference between a flimsy guess and a data-backed plan that investors will actually take seriously. This is where you have to move beyond wishful thinking and pin down the real drivers of your business.
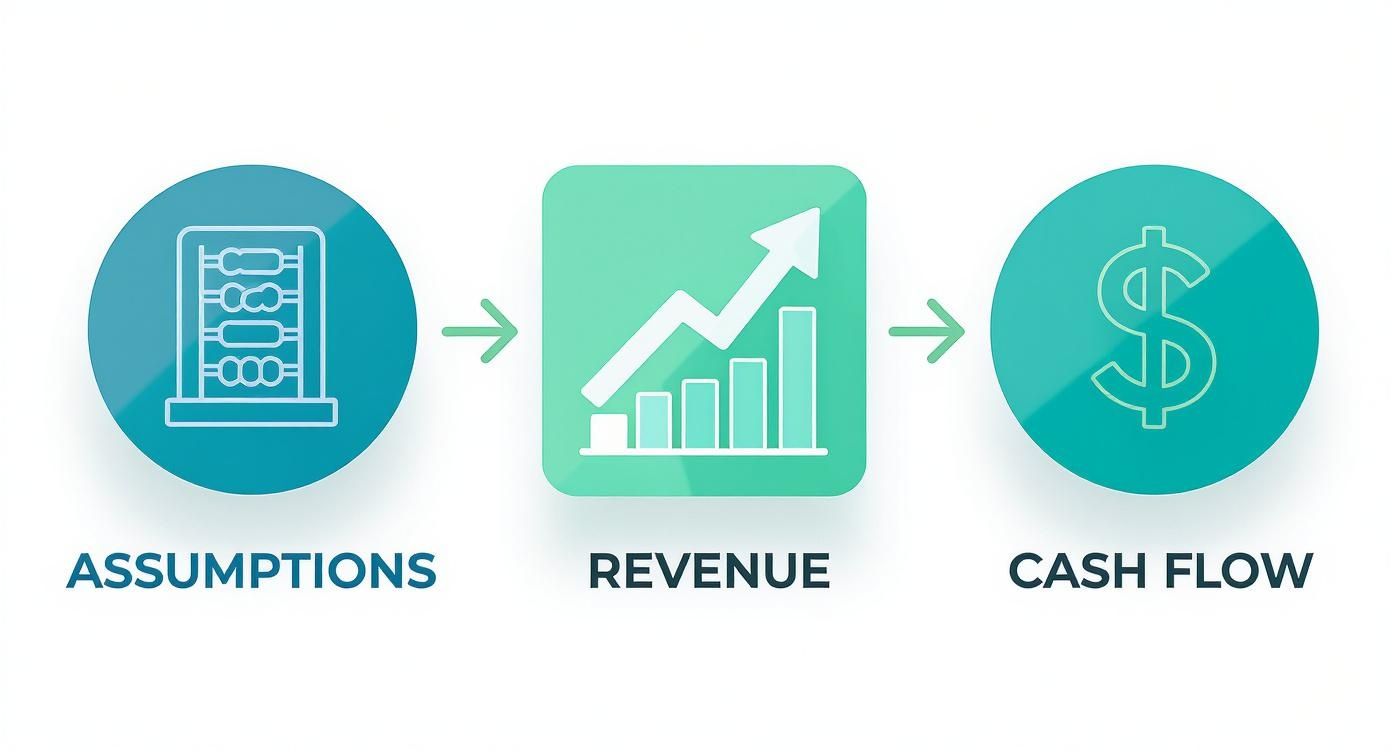
As you can see, strong assumptions are the true starting point for everything else. Get this tab right, and the rest of your financial story will naturally fall into place.
Defining Your Core Growth Drivers
Before you can project a single dollar of revenue, you have to get real about the mechanics of your growth. What are the key levers you can actually pull to scale the business? This isn’t about plucking numbers out of thin air; it’s about building a logical case for each one based on research, early data, or industry benchmarks.
You'll want to focus on a few essential metrics first:
- Customer Acquisition Cost (CAC): Seriously, how much does it cost you to win a new paying customer? Be specific. If you spend $10,000 on Google Ads and get 25 new customers, your CAC for that channel is $400. Don't fudge this.
- Lifetime Value (LTV): What’s the total profit you expect from an average customer over their entire time with you? For a SaaS business, a simple way to estimate this is by dividing your Average Revenue Per Account (ARPA) by your customer churn rate.
- Customer Churn Rate: What percentage of customers are you losing each month or year? A 5% monthly churn can silently kill a startup, while a 1% rate is often seen as a healthy benchmark in SaaS.
- Sales Conversion Rate: Of all the leads you generate, how many actually become paying customers? This is the glue that connects your marketing spend directly to revenue.
"A common mistake founders make is treating their assumptions as an afterthought," notes business strategist Robbie LaMattina. "Investors will immediately stress-test these numbers. If you can't defend the 'why' behind your CAC or churn rate, the rest of your model falls apart."
To help you get started, here’s a quick reference table with some typical benchmarks. Remember, these are just guides—your own data, however limited, is always better.
Key Assumption Benchmarks for Early-Stage Startups
| Metric | SaaS Business | E-commerce Business | Service-Based Business |
|---|---|---|---|
| LTV:CAC Ratio | 3:1 to 5:1 | 3:1 to 4:1 | 4:1 to 6:1 |
| Monthly Churn Rate | 1-3% (healthy) | N/A (focus on repurchase rate) | <5% |
| Sales Conversion Rate | 2-5% (from qualified lead) | 1-3% (site-wide) | 20-30% (from proposal) |
| CAC Payback Period | < 12 months | < 6 months | < 3 months |
These numbers can give you a sanity check. If your assumptions are wildly different, you’d better have a very good story to explain why.
From Assumptions to a Realistic Forecast
Once you have these drivers locked in, you can start building a "bottom-up" forecast. This approach is way more credible than a "top-down" model where you just claim you’ll capture "1% of the market." Instead, you're linking your growth directly to things you'll actually do and spend money on.
Let's walk through a quick scenario for a B2B SaaS startup:
- You've set a target CAC of $400.
- Your LTV is projected to be $2,500, giving you a healthy 6.25x LTV:CAC ratio.
- You plan to spend $20,000 per month on marketing in your first year.
With these assumptions, your model would project acquiring 50 new customers each month ($20,000 / $400 CAC). See? That single calculation, rooted in clear assumptions, becomes the bedrock of your entire revenue projection. The same logic applies to hiring. If one salesperson can close 5 deals a month, your hiring plan has to line up with your customer acquisition goals.
This is exactly why a structured template is so valuable. According to a survey by SCORE, over 78% of startups that successfully raised seed or Series A funding used a formal financial model. You can dig into their findings in their financial projections template resource.
Mapping Out Your Expenses
The assumptions tab isn't just for the fun stuff like revenue; it's also where you forecast your major expenses. Please, don't just lump your costs into big, generic categories. Break them down with the same driver-based logic.
- Salaries & Benefits: Don't just guess a total payroll number. List out each role you plan to hire, their start date, and their salary. And don't forget to add another 20-30% on top for payroll taxes, benefits, and other overhead.
- Marketing & Sales Spend: This needs to tie directly back to your CAC and revenue goals. If your plan requires 100 new customers next month, your marketing budget assumption better be able to support that.
- Software & Tools: List your key subscriptions—your CRM, accounting software, cloud hosting. These costs often grow right alongside your team, so plan for that.
- General & Administrative (G&A): This is your catch-all for rent, legal fees, insurance, and other operational costs.
When you ground every number in a specific, documented assumption, your financial model transforms from a work of fiction into a strategic tool. It becomes a roadmap you can actually use to run your business and present to investors with confidence.
Forecasting Revenue and Cost of Goods Sold
With your core assumptions nailed down, we can move on to the part of your financial model that gets the most attention: the revenue forecast. This is where you tell your growth story. You're not just throwing numbers on a page; you're showing investors a credible, step-by-step plan for how you’ll build your business.
Let’s be honest, a flimsy revenue projection is the fastest way to lose an investor’s trust. They’ve seen it all before. A believable forecast is built from the ground up, month by month. It’s less about picking a big, impressive number for the end of the year and working backward, and more about showing the logical build-up that gets you there. This is what separates a simple spreadsheet from a powerful startup financial projections template.
Choosing Your Revenue Modeling Approach
You'll hear people talk about two main approaches to forecasting: bottom-up and top-down. A top-down analysis (like saying "we'll capture 1% of a $10 billion market") might sound impressive, but it’s mostly for context. Investors almost always want to see a bottom-up forecast because it’s grounded in reality.
A bottom-up model connects every dollar of revenue directly to your own activities and resources.
- For a SaaS Company: Your forecast might be built on the number of new leads your marketing budget generates, multiplied by your sales conversion rate. Let's say you plan to acquire 50 new customers at $99/month. That’s a tangible $4,950 in new Monthly Recurring Revenue (MRR).
- For an E-commerce Store: The model would be driven by projected website traffic, your conversion rate, and your Average Order Value (AOV). If you expect 10,000 visitors, convert 2% of them, and have a $75 AOV, that’s a clear path to $15,000 in monthly revenue.
Building a revenue forecast is really an exercise in logic. You have to be able to tell the story behind every dollar. If you can't connect your growth to a specific sales hire, a marketing campaign, or a new product feature, investors simply won't believe it.
This isn’t just good practice; it has a real impact. Research from Kruze Consulting found that startups using templates with detailed revenue driver assumptions were 30% more likely to hit their fundraising targets. It shows that investors value a well-thought-out, defensible plan.
Calculating Cost of Goods Sold to Find Gross Profit
Once you have a handle on revenue, you need to figure out your Cost of Goods Sold (COGS). These are the direct costs tied to creating and delivering your product or service. Getting this right is absolutely critical because subtracting COGS from your revenue gives you Gross Profit—a number that every single investor zooms in on.
What counts as COGS can look very different depending on your business model:
- SaaS: Think direct costs like server hosting (e.g., AWS), data processing fees, and the salaries of the customer support team that directly serves paying users.
- E-commerce: This is more straightforward. It includes the cost of your inventory, packaging materials, and shipping fees.
- Service Business: Here, the biggest chunk of COGS is usually the salaries of the people who are directly delivering the service to clients.
Knowing the difference between COGS and Operating Expenses (OpEx) is crucial. Your sales team's salaries? That's OpEx. Your customer support team's salaries? That's COGS. This distinction is vital for calculating your Gross Margin (Gross Profit / Revenue), which is a key measure of your business's core profitability and scalability. If you want to dig deeper, it’s worth exploring the various revenue forecasting methods out there.
Ultimately, a strong revenue and COGS forecast is more than just a set of numbers—it’s proof of your strategic thinking. It shows you truly understand the levers that drive your business and have a credible plan to scale efficiently. Improving these core metrics is fundamental, and you can find great strategies for improving profit margins to make your model even stronger.
Mapping Out Operating Expenses and Your Hiring Plan
A great revenue forecast can get you excited, but it's only telling half the story. The other, arguably more critical, half is your Operating Expenses (OpEx). This is where you get real about the costs of actually building and running the business—everything from salaries and software subscriptions to the office coffee.
How you manage this side of the ledger, often called your "burn rate," is what determines if you survive.
Growth costs money. A well-thought-out financial model forces you to connect every dollar of spending to a specific goal. Investors are looking for capital efficiency. They want to see that you have a plan and aren't just burning cash without a clear link to driving sales or making the product better. This is your chance to prove you can be a good steward of their investment.
Breaking Down Your Core Operating Expenses
To get a true handle on your cash burn, it's best to organize your OpEx into the three standard buckets. This is the structure investors know and expect, and it helps you think logically about where the money is really going.
- Sales & Marketing (S&M): This is everything you spend to get customers in the door. Think salaries for your sales and marketing folks, ad spend on platforms like Google or Meta, conference fees, and sales commissions.
- Research & Development (R&D): These are the costs directly tied to building and improving your product. This bucket includes salaries for your engineers, designers, and product managers, plus any specialized tools or software they need to work their magic.
- General & Administrative (G&A): This is the catch-all for the essential overhead of just running the business. It covers salaries for your executive and operations teams, rent, legal and accounting fees, insurance, and office supplies.
A rookie mistake I see all the time is lumping every salary into one giant number. You absolutely have to separate them by department (S&M, R&D, G&A). It gives you and your investors a much clearer snapshot of your priorities and shows exactly how much you’re plowing into growth versus product versus overhead.
Building a Detailed Hiring Plan
Let's be clear: your single biggest operating expense will almost always be payroll. That’s why your hiring plan can't just be a vague headcount number. It needs to be a detailed, month-by-month forecast. This is a non-negotiable part of any credible financial model.
For every single role you plan to hire, your model needs to specify the start date, annual salary, and the department they'll be in.
But don't just plug in the base salary. You have to account for the fully-loaded cost of each employee. A solid rule of thumb is to add an extra 20-30% on top of their base salary to cover all the essential overheads, such as:
- Payroll taxes (FICA, unemployment)
- Health insurance benefits
- Retirement plan contributions (like a 401k match)
- Workers' compensation insurance
For instance, that software developer you're hiring with a $120,000 base salary? They're really going to cost your company closer to $150,000 a year. Missing this detail is a classic way to wreck your cash flow forecast and find your runway is much shorter than you thought.
Your hiring plan also has to make sense alongside your revenue goals. If your model shows a massive spike in new customers in Month 6, your hiring plan had better show the new sales reps and customer support staff starting in Month 4 or 5 to make it happen. That kind of foresight shows you truly understand the operational levers you need to pull to scale. For more on this, our guide on how to scale a service business has some fantastic, practical insights.
By mapping out your expenses with this level of detail, you're not just filling out a spreadsheet—you're creating a clear, defensible picture of your monthly burn rate and proving you have a realistic plan to manage your resources.
Reading the Tea Leaves: Analyzing Your Financial Statements and Key KPIs
Once you've plugged in your assumptions and laid out your revenue and costs, the startup financial projections template will automatically spit out the three core financial statements. But just having them isn't enough. The real skill is learning to read the story they tell. This is where you move from being a bookkeeper to a strategist, turning raw data into a compelling narrative about your startup's future.
It’s about looking past the obvious numbers and focusing on the Key Performance Indicators (KPIs) that really move the needle for investors and experienced founders. When an advisor like Robbie LaMattina sees a founder who knows these metrics inside and out, they see someone with a firm grip on their business.

What Your Three Core Statements Are Telling You
Think of each financial statement as a different camera angle on your business. When you look at them together, you get a complete, three-dimensional view of your company's health, stability, and growth potential. Let's break down what each one really means.
-
The Income Statement (P&L): This is basically your profitability report card. It answers one simple question: Is this business model actually working? Don't just glance at the net income. Dig into your Gross Margin (Revenue – COGS / Revenue). A healthy, consistent gross margin is a sign of a strong core business that can scale without falling apart.
-
The Balance Sheet: This is a snapshot in time—a picture of your company's financial health on a specific day. It lists what you own (Assets) and what you owe (Liabilities). For an early-stage company, the key thing to watch is the balance between current assets and current liabilities. This tells you if you have enough short-term cash to cover your short-term bills.
-
The Cash Flow Statement: For any startup, this is arguably the most important document of the three. It's the ultimate reality check, tracking the actual cash coming into and flowing out of your bank account. You can look profitable on your P&L but go bankrupt because customers aren't paying their invoices on time. This statement is where you find your true cash runway.
An investor once told me, "Your P&L is your ego, your Balance Sheet is your anchor, but your Cash Flow Statement is your pulse." That's because cash is the oxygen for a startup. Running out of it is the one mistake you can't recover from.
Focusing on the KPIs That Truly Matter
With your statements ready, it's time to zero in on the KPIs that signal whether your business model is sound. These metrics are the language investors speak, and they’re critical for making your own smart decisions. The trick is to avoid drowning in data—just focus on the vital few.
For most tech and SaaS startups, these are the non-negotiables:
- Monthly Recurring Revenue (MRR) Growth: If you have a subscription model, this is everything. You need to track not just the overall growth, but where it's coming from: new customers, existing customers upgrading (expansion MRR), and customers leaving (churned MRR). Sustainable growth comes from both winning new business and keeping current customers happy.
- LTV:CAC Ratio (Lifetime Value to Customer Acquisition Cost): This is the ultimate test of your marketing and sales efficiency. A ratio of 3:1 or better is the gold standard, proving your business model is sustainable. It shows that for every dollar you spend to get a customer, you make at least three dollars back over time.
- CAC Payback Period: How many months does it take to earn back the money spent to acquire a customer? A short payback period—ideally under 12 months—is a powerful sign. It means you can recycle your capital back into growth much, much faster.
- Cash Runway: This one is brutally simple but the most important of all. It’s your total cash divided by your monthly net burn rate. In other words, how many months until you hit zero? You should know this number cold. Always.
Using financial projection templates has become a standard practice for startups worldwide, with hubs in the U.S., U.K., and Germany leading the way. In fact, template usage has jumped by 45% in the last five years, thanks in large part to great online tools. You can read more about these trends in financial projection templates to see why they've become so essential.
Ultimately, mastering these KPIs is what separates founders who are just running a business from those who are strategically building a valuable asset.
Frequently Asked Questions About Financial Projections
Diving into financial forecasting for the first time can feel a little overwhelming. That's perfectly normal. Getting straight answers to your questions is the first step toward building a startup financial projections template that gives you—and your potential investors—real confidence.
Let's break down some of the most common questions I hear from founders.
How Far Out Should My Projections Go?
For most startups heading into a seed or Series A round, a 3-year projection is the standard. You might see some templates go out to five years, but honestly, investors tend to view anything beyond year three as educated guesswork.
The trick is to get granular for the near term. I always advise founders to break down the first 12-18 months on a month-by-month basis. After that, you can switch to quarterly or annual summaries. This shows you have a tight grip on your immediate operational plan while still keeping an eye on the bigger picture.
According to business advisor Robbie LaMattina, "Investors want to see that you can manage the next four quarters with precision. The monthly detail proves you've thought through the operational steps, while the annual view shows your ambition."
What's the Biggest Mistake Founders Make?
I see it all the time: a wildly optimistic "hockey stick" revenue curve that isn't backed by anything concrete. It's the quickest way to lose credibility with an investor.
A strong financial model has to be built from the ground up. Your revenue growth should be a direct result of tangible drivers—things like your marketing budget, how many deals your sales team can realistically close, and what your conversion rates actually look like. Your assumptions tab is where you prove your work. If it's filled with wishful thinking instead of a data-driven plan, the whole forecast falls apart.
How Can I Create Projections if I'm Pre-Revenue?
This is a great question. When you don't have historical data, the entire focus shifts to your go-to-market strategy and the assumptions that underpin it. You have to build your forecast from the bottom up, based on the specific actions you plan to take.
For instance, your model should clearly outline:
- Your planned marketing budget.
- The expected cost-per-click (CPC) for your ad campaigns.
- Your target website conversion rate.
- The average deal size you anticipate.
This approach proves you have a thought-out, measurable plan for landing those crucial first customers. In this pre-revenue stage, your expense forecast—especially your burn rate and runway—becomes the most important piece of the puzzle.
At Robert LaMattina, we provide pragmatic insights to help entrepreneurs build resilient businesses. Explore more data-driven strategies for growth at https://robertlamattina.net.